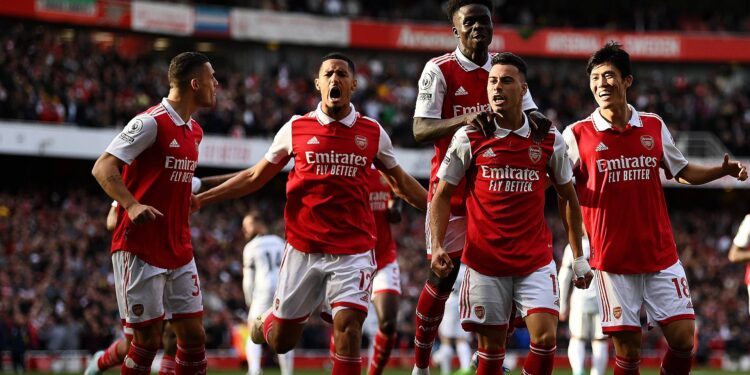
According to a Deloitte report, the Premier League is home to more than half of the world’s wealthiest teams in terms of income.
In their Money League analysis from the 2021–22 season, eleven Premier League teams are in the top 20.
More than half of the clubs come from the same league for the first time in the 26-year history of the survey.
Champions With 731 million euros ($719.1 million), Manchester City maintained their lead over Real Madrid (713.8m euros).
Read also: Pep Guardiola, manager of Manchester City, accepts responsibility for Haaland’s scoring slump.
With Manchester United, Chelsea, Tottenham, and Arsenal rounding out the top 10, along with West Ham, Leicester, Leeds, Everton, and Newcastle, Liverpool jumps to third place from seventh.
The top 20 clubs made 9.2bn euros (£7.82bn), a 13% increase from 2020-21.
That increase is largely down to the return of fans to stadia for the first full season after Covid-19 restrictions, with matchday revenue rising from 111m euros to 1.4bn euros.
Five of the Premier League’s ‘big six’ – Chelsea, Liverpool, Manchester City, Manchester United and Tottenham Hotspur – reported revenue increases of 15% or more. That saw a total increase of 226m euros.
Commercial revenues rose 8%, from 3.5bn euros to 3.8bn euros (£2.975bn to £3.23bn) but there was an 11% (485m euros/£412.25m) fall in broadcast revenue. Last season’s figures were higher than usual because of postponed matches from the 2019-20 season being played.
| Position (last year’s position) | Club | 2021-22 revenue (£m) | 2020-21 revenue (£m) |
|---|---|---|---|
| 1 (1) | Manchester City | 619.1 (731m euros) | 571.1 (644.9m euros) |
| 2 (2) | Real Madrid | 604.5 (713.8m euros) | 567.3 (640.7m euros) |
| 3 (7) | Liverpool | 594.3 (701.7m euros) | 487.4 (550.4m euros) |
| 4 (5) | Manchester United | 583.2 (688.6m euros) | 494.1 (558m euros) |
| 5 (6) | Paris St-Germain | 554 (654.2m euros) | 492.5 (556.2m euros) |
| 6 (3) | Bayern Munich | 553.5 (653.6m euros) | 541.4 (611.4m euros) |
| 7 (4) | Barcelona | 540.5 (638.2m euros) | 515.4 (582.1m euros) |
| 8 (8) | Chelsea | 481.3 (568.3m euros) | 436.6 (493.1m euros) |
| 9 (10) | Tottenham Hotspur | 442.8 (523m euros) | 359.7 (406.2m euros) |
| 10 (11) | Arsenal | 367.1 (433.5m euros) | 324.5 (366.5m euros) |
| 11 (9) | Juventus | 339.3 (400.6m euros) | 383.5 (433.1m euros) |
| 12 (13) | Atletico Madrid | 333.6 (393.9m euros) | 294.7 (332.8m euros) |
| 13 (12) | Borussia Dortmund | 302.2 (356.9m euros) | 298.9 (337.6m euros) |
| 14 (14) | Inter Milan | 261.2 (308.4m euros) | 293 (330.9m euros) |
| 15 (16) | West Ham United | 255.1 (301.2m euros) | 196.1 (221.5m euros) |
| 16 (19) | AC Milan | 224.4 (264.9m euros) | 191.5 (216.3m euros) |
| 17 (15) | Leicester City | 213.6 (252.2m euros) | 226.2 (255.5m euros) |
| 18 (n/a) | Leeds United | 189.2 (223.4m euros) | 168.6 (190.4m euros) |
| 19 (18) | Everton | 181 (213.7m euros) | 193.1 (218.1m euros) |
| 20 (n/a) | Newcastle United | 179.8 (212.3m euros) | 150.6 (170.1m euros) |
| For non-British clubs Deloitte has used an average exchange rate for the year ending 30 June 2022 (€1 = £0.85; €1 = BRL 5.92; €1 = CHF 1.05; €1 = DKK 7.44; €1 = TRY 13.82). |


